Pivot points in trading

Pivot points are a classical intervention technique in the Stock Market. I like it for its simplicity and above all its effectiveness.
Pivot points (PP), Resistance (R1 R2 R3) or Support (S1 S2 S3) are impressive because of the clear indications they can give the trader.
What is a Pivot Point?
The Pivot Point is intended to provide psychological areas in which indices, shares etc. have a high chance of stabilising, of rebounding on a support or dropping on a Resistance. Intellectually, it makes no sense, but because many investors use the pivot points technique, that means it makes sense ... on the principle of self realization.
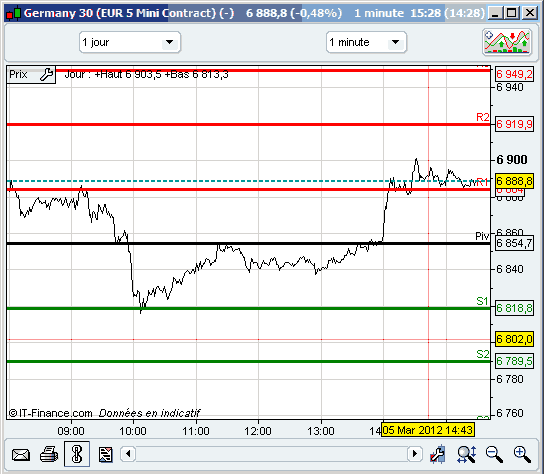
Here we see for example that, from 8am to 9am in the pre-market, R1 acts as a resistance, the pivot point led to a mini rebound (scalping) before going to see S1 which served as a rebound zone (scalping or day trading ). Following the good news, the price rebounded at 2pm from PP to R1 and was contained on R1 while waiting the opening of the U.S. markets.
How to calculate a pivot point?
There are several formulas for calculating pivot points, resistance and other support levels. Let me give you the most classical, the most commonly used, and by implication the most effective.
Pivot = (H + B + C) / 3
S1 = (2 x Pivot) - H
S2 = Pivot - (H - B)
S3 = B - 2x (H - Pivot)
R1 = (2 x Pivot) - B
R2 = Pivot + (H - B)
R3 = H + 2x (Pivot - B)
S1, S2 and S3 are the 3 Support levels R1, R2 and R3 are the 3 Resistance levels with H being the highest price the day before, B being the lowest price the day before and C being the closing price. Don't worry; your trading software will calculate this without any problem.
The other Pivot Point formulas
Here you will find formulas for Camarilla pivot points and Woodie pivot points, which are the most famous.
Variant of calculating pivot points in classical mode: Pivot = (H + B + C + O) / 4 or Pivot = (H + B + O / 3 = where O = the highest of the day (it is therefore an evolutionary computation in the day).
What unit of time to use for pivot points?
Generally, pivot points, resistance and support levels in daily UT are used to do day trading, which is logical. We anticipate for example a rebound on the R1 support for a return to the pivot point. Of course, the context is essential to assess whether R1 R2 or R3 are more likely to counter a drop.
In scalping, these levels are also interesting if the market stabilizes on a resistance or support. One can then scalp on the micro variations of the defined area. It is however more delicate with scalping because you have to take into account the time of the day; a stabilization between 2 pm and 3 pm is more likely to stay on a support or resistance (waiting for the U.S. market) than at 9:30 am when the market is finding its feet, and this is more dangerous for scalping.
For swing trading, weekly levels are effective; for long trading, monthly pivot points are preferred.
Strengths of pivot points
A major strength of pivot points is that the levels are determined before the price opening so as to establish a trading plan, to immediately and easily identify areas of tension for the day trading. Furthermore, these psychological areas work well; they are well monitored by traders; and that is all we ask.
Weaknesses of pivot points
Levels determined by pivot points work especially well in a quiet or regular-trend market. In the case of very bad news for example, support levels S1 S2 S3 will not last. If they crash, they will not be effective at all, unless you calculate up to S8). Pivot points must be used in a fluctuating context; they are not absolute.
Some uses of Pivot Points in trading
I will not go into details; this will be handled in another article.
Note however that when S3 is broken in intraday, there is a high probability to go back to this support except where there is a major crash. Similarly, an S3 affected on a monthly unit of time is often a rare opportunity to take a long trading position.
Take this advice even in the case of day trading and the display of daily and weekly pivots simultaneously; if we arrive at S1 daily and S2 weekly for example, it strengthens the possibility of a rebound.
Conclusions on Pivot Points
The simplest things often work best. Pivot points can be used in many ways: determining a possible rebound area (of purchase) with the support, a resistance area (of sales or profit earning). In any event, you definitely need to use them, monitor them and you will see that the market often follows them.

Why do I trade CFDs and Futures at the same time?
Why do I trade with ProRealTime CFD and ProRealTime Futures?
Try a Free Demo Account or a Real acount


4 Comments for Pivot points in trading
After find S1 S2 S3 & R3 R2 R1 how to use for trading.
With ProRealTime it's simple, it's software
Dear Team How i can use it in intraday Trading plz advise
Do you use ProRealTime ?